Scala Debugger
Goals
The idea is to provide a debugger inside Scala IDE more targeted to Scala code.
The main goals are:
- Hide the artifacts created by the Scala compiler
- Have an intuitive stepping through Scala code
- Identify elements as Scala
Where to get it?
The Scala debugger is a part of Scala IDE and is released as a whole.
Using the Scala debugger
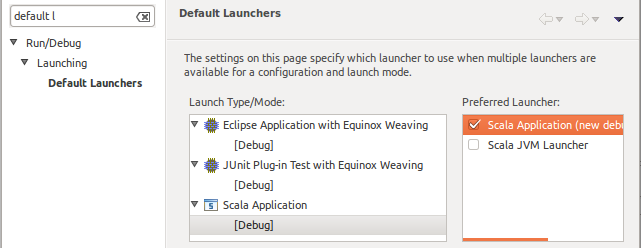
The Scala debugger is available as an alternate debug mode launcher for the Scala applications and Equinox Weaving Eclipse applications.
It can be set as the default launcher from the Run\Debug → Launching → Default Launchers preferences:
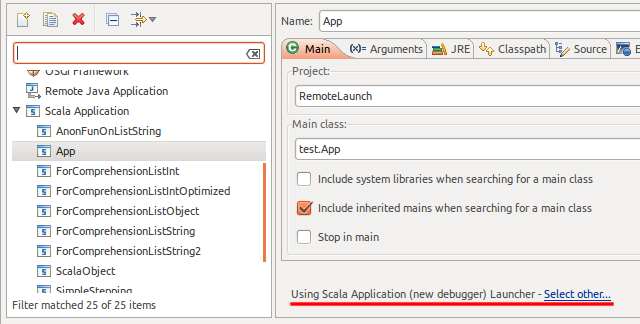
Or it can be selected in each launch configuration:
Features
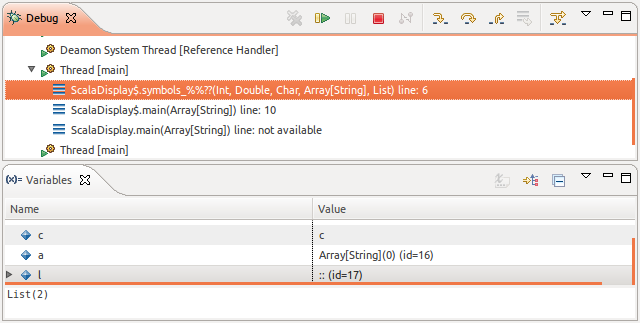
Scala-like display
In the different views (debug, variables, and more later), the types and methods are displayed the way they would be written in Scala code.
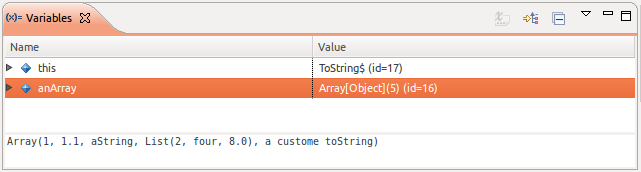
toString display
In the variables view, the detail pane show the toString value, or its equivalent, for the currently selected entity.
Logical structures support
By default, the variables view shows the internals of each entity.
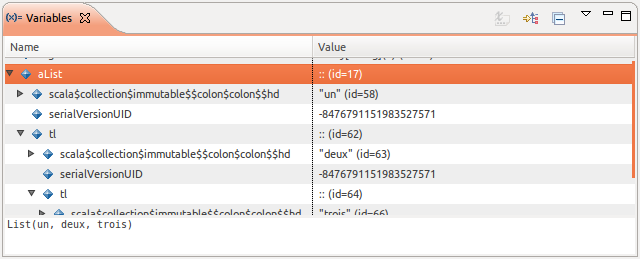
But in a lot of cases, it is not the sought after information. Using the Show Logical Structure toolbar button, the data is shown is a more synthetic way.
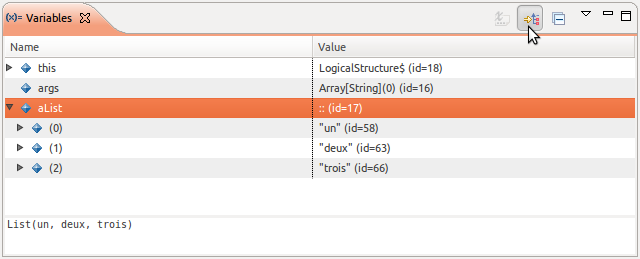
In the preview version, only support for List has been tested
Smart stepping
A normal Java debugger is made to debug applications written in Java. It cannot handle concept like closures.
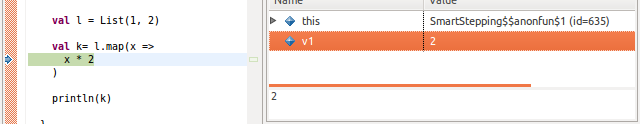
In a situation like the following, it would jump the full map call when asked to do a ‘step over’.
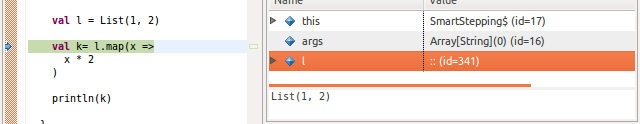
The Scala debugger is able to find those and stop inside the closure. The closure variables are visible.
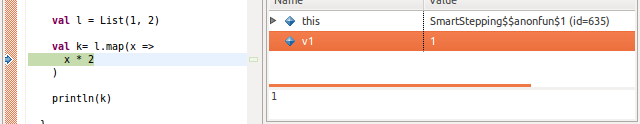
After an other ‘step over’, the debugger stops at the evaluation of the closure for the second element.
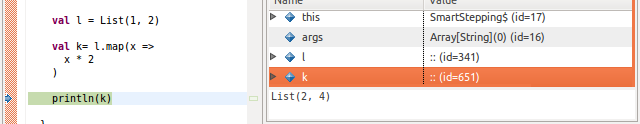
At the next ‘step over’, the debugger exits the map call, and stop at the assignment. After an extra ‘step over’, the result is visible in k.
The same way, the ‘step into’ action allows you to step right into the closure, and the ‘step out’ action to return to the original call.
In the preview version, ‘step into’ is not working fine with primitive types
Step filters
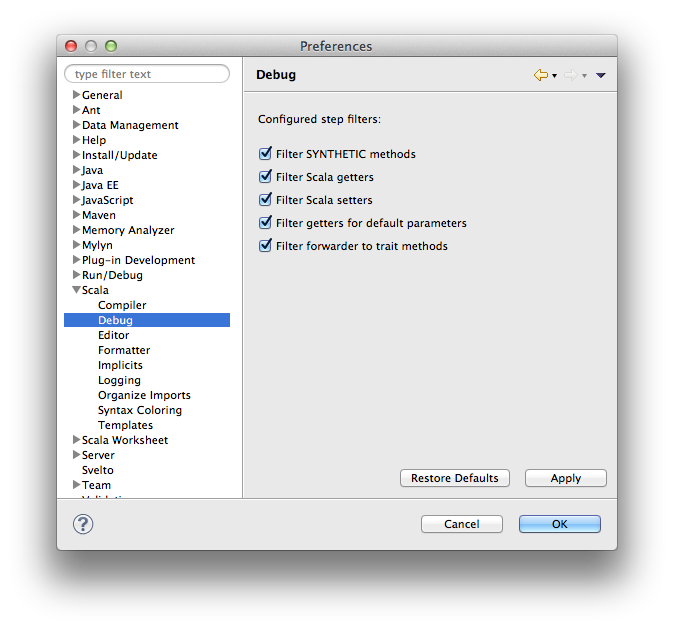
Often when stepping in and out of Scala methods you don’t want to stop in all the artifacts produced by the Scala compiler. Those includes:
- synthetic methods
- Scala getters for val members
- Scala getters and setters for var members
- getters for default argument (ending in $default$1,2,..)
- forwarders for concrete trait methods
You can enable/disable step filters on the debugger configuration page:
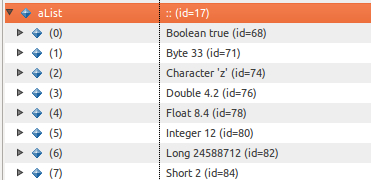
Boxed primitive values
The value of boxed primitives is extracted to be displayed.
Clean stack frame list
Smart stepping ‘hides’ the internal details of collections and closure. This information is also hidden in the debug view, only the relevant stack frames are displayed.
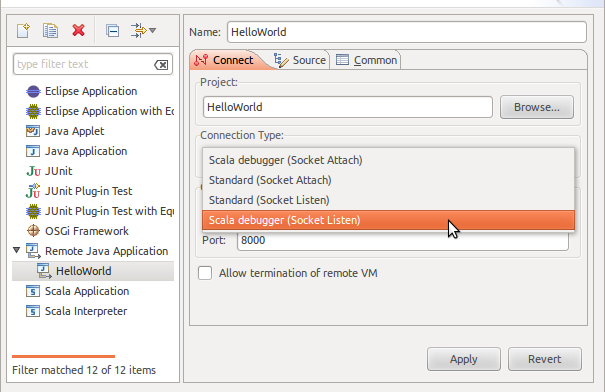
Remote Debugging
Using the Scala debugger for a remote debugging session is done by selecting one of the Scala connector in a normal ‘Remote Java Application’ launch configuration. The remainder of the configuration is the same as for Java remote debugging.
Drop to frame new (since 4.0)
Select the Drop to Frame command to re-enter the selected stack frame in the Debug View.
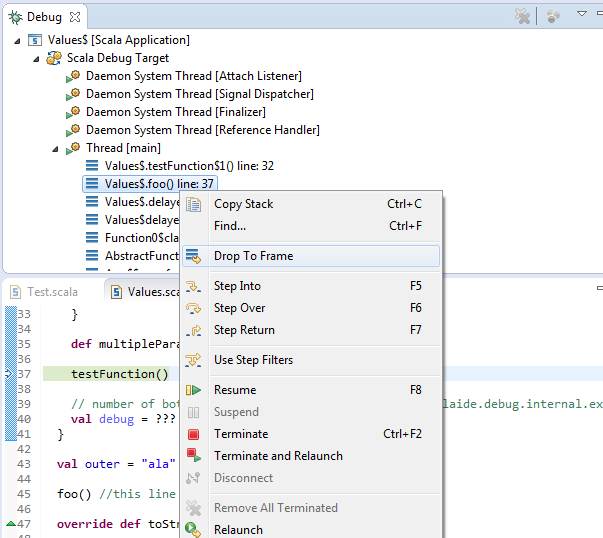
Note
This command is only available if the current VM supports dropping frames and the stack frames between the one below selected stack frame and the top one are not in a native method.
Hot code replace new (since 4.1)
Hot code replace adds the possibility to modify and re-compile code in a debug mode and to have these changes visible and taken into account by the debugged VM without restarting the application.
Note
HCR is limited by JVM’s support for replacing classes. Its goal is to allow to experiment with the code inside methods/blocks rather than to develop the whole application in the interactive mode. Changes of methods’ signatures etc. do not work - similarly to other HCR implementations in Eclipse or other IDEs.
Configuration
Warning
This feature is turned off by default and can be turned on in preferences. The reason is that it’s the initial implementation. It may be very helpful, but there are also known issues:
- JVM doesn’t like obsolete frames. Therefore, there are situations when it may crash after HCR.
- Automatic dropping frames may not work when running two or more HCRs one after another without going further with the execution (resume and hit another breakpoint, step into etc.).
These problems should disappear in the future after adding to HCR the missing feature which we are aware of.
Multiple parameters of HCR can be configured in menu:
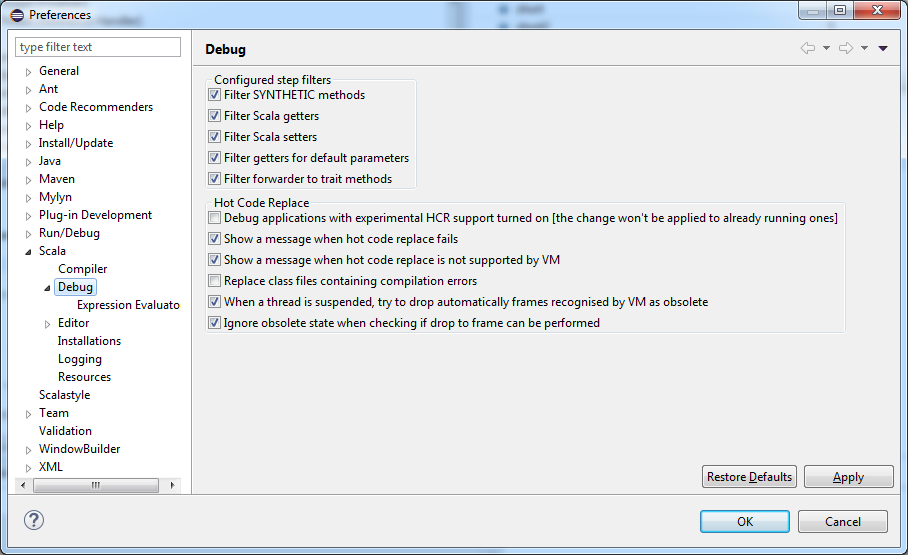
Those allows to:
- enable or disable HCR,
- configure whether error messages from HCR should be shown,
- change whether files containing compilation errors should be skipped,
- automatically drop (or not) obsolete frames on suspended threads,
- and ignore obsolete state of frames when performing drop to frame (in other words, allow to drop obsolete frames manually). This one may be needed only if you disable automatic drop to frame after HCR.
Expression evaluator new (since 4.1)
Scala debugger since 4.1 features new expression evaluator, which translates user code into invocations of JDI remote calls. This allows evaluation of expression in context of breakpoint, with access to local variables and methods.
For more detailed documentation, with examples and limitations see Expression evaluator user documentation.
Further improvements and unsupported features
may not be exhaustive, not really ordered, updated 2015-04-27
- Take care of breakpoints in Scala Debugger, currently still done by JDT debugger
- Use own jdi event dispatcher, instead of using the JDT debugger one
- Set the right icon according to the element type and state
- Improve the labels
- Running, Suspended, Terminated suffix on debug target and thread
- option to display simple or fully qualified types
- clean way to display object name, without the $
- filtered stack frames option
- to hide some Scala internals, like collections
- configurable list in preferences
- filter synthetic elements in the variable view
- extension point for additional support of logical structures
- use IIndexedValue for arrays
- better smart step into support
- collection of primitive type elements
- step over and step out relative to the currently selected stackframe
- cache data used for smart stepping
- result of findAnonFunction
- keep enabled ClassPreparedRequests to avoid requesting allClasses every time
- better Scala breakpoints
- may still need to be based on Java breakpoints
- smarter add breakpoint
- method breakpoint support
- watchpoint support
- display the value returned by the last executed method (a proof of concept is working. Need to define the exact behavior and devise a way to present the value)
Development setup
The Scala debugger adds 4 new plugins, 2 for debugger: org.scala-ide.sdt.debug, org.scala-ide.sdt.debug.tests and 2 for expression evaluator: org.scala-ide.sdt.debug.expression, org.scala-ide.sdt.debug.expression.tests
In Eclipse
The Scala debugger makes use of the JDI to communicate with the VM. For some valid reasons, the jdt.debug plug-in provides a non-generic version of it. The Scala debugger uses the newer generic version, so some tweaking is needed inside Eclipse.
On Mac OS X
The generic version of the JDI is included by default in the VM libraries, just remove the JAVA_HOME/lib/tools.jar entry from the Java build path to have the project to compile.
On the other OSes
On non-Mac OS X systems, JDI is not part of the VM default libraries. To steps are needed to have the project to compile correctly:
- create a Classpath Variable in Window → Preferences → Java → Build Path → Classpath Variables named JAVA_HOME, which points to the root folder of your JDK installation.
- in Window → Preferences → Java → Installed JREs, edit your JDK, and use Add External JARs to add the JDK_HOME/lib/tools.jar library.